
Overview:
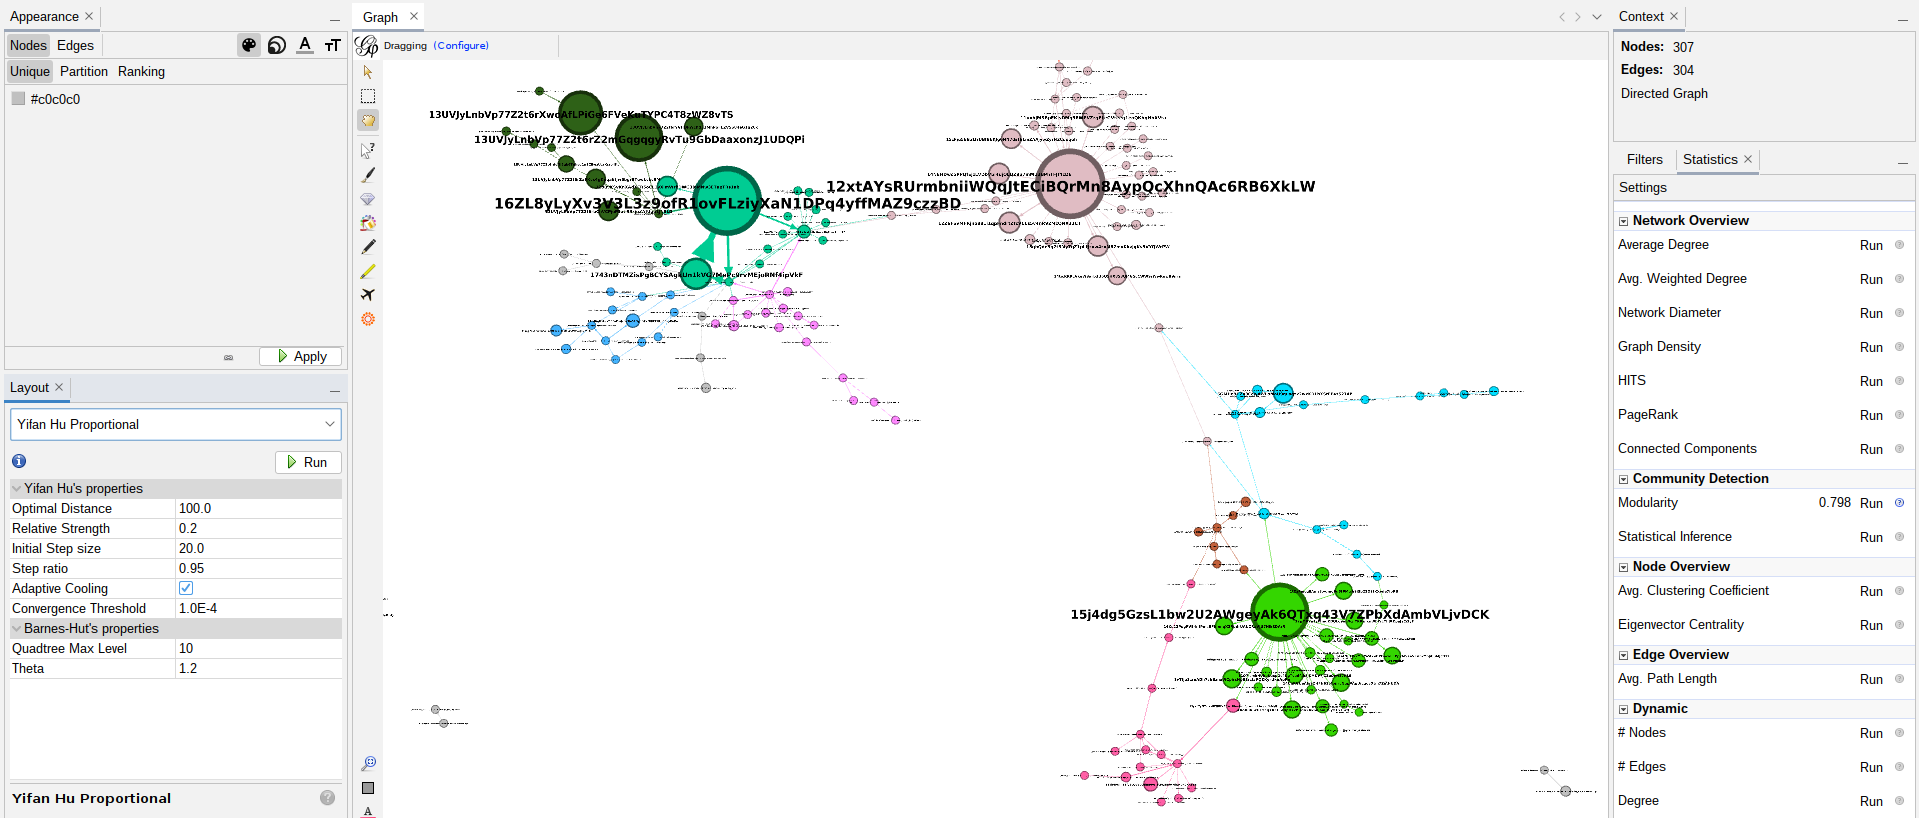
This post is on a project I have been working on named Visualizing-Substrate. It is a program that can access database .db files and use RPC/API calls to substrate-based chains (currently Polkadot and Kusama) to create nodes and edges based on addresses, balances, and transaction data for the entire history of the chain. Addresses and transactions converted to nodes can be chosen based on current address holding and or transaction sizes. The project is currently written in typescript utilizing npm SQLite packages to access the database. Output from my program is designed to be used with Gephi (an open-source network analysis and visualization software) to visualize and organize the nodes and edges with layout algorithms such as the Yifan Hu algorithm an example of which above.

Description
I came up with the idea out of an interest to identify connected accounts and be able to visualize where native tokens on the Kusama blockchain were and who had them. With this program it is easy to identify where assets originate on-chain, where they are currently, and the path they took to get there. Using the community detection algorithm named Modularity also allows me to color nodes by groups depending on their connections. A good example of this is the orange, teal, green, and blue color groups below that all interact with seemingly central nodes. These different colored groups are based on the exchanges that the nodes interact with.

The database that I used to create the nodes and edges in this project was created using polka-store. Polka-store is a Node.js program written in typescript which scans a Polkadot chain (Polkadot/Kusama/Westend) and stores balance-relevant transactions in a SQLite database. This is needed because Polkadot itself does not directly store transaction data, and requires an API or block explorer to get transaction data which can be slow. With an SQLite database accessing transaction data is fast and can be done with SELECT cases. The database structure looks as follows.
| Column | Description |
|---|---|
| chain | chain name |
| id | unique id |
| height | bock height |
| blockHash | block hash |
| type | extrinsic method |
| subType | extrinsic submethod (e.g. in a ‘utility.batch’ extrinsic) |
| event | the event triggered by the extrinsic |
| timestamp | unix timestamp (in ms since Jan 1, 1970) |
| specVersion | runtime version |
| transactionVersion | transaction version |
| authorId | the account id of the block validator |
| senderId | the account id of the block signer / transaction sender |
| recipientId | the account id of the transaction recipient |
| amount | the amount which was sent or rewarded |
| totalFee | the fee which was paid by the block signer |
| feeBalances | the part of the totalFee that passed to the block author |
| feeTreasury | the part of the totalFee that passed to the treasury |
| tip | an additional tip paid by the block signer (is part of feeBalances) |
| success | the transaction was successfull |
From this database I need the transactions where the event was a “balances.Transfer” event. From those transactions, I then need the senderId, recipientId, amount, and height values to create my nodes and edges. To do this a created a function to get rows with the desired values using a SELECT FROM WHERE statement. This function also enables me to request transfer transactions after a certain block height and greater than a chosen value in Dot.
1
2
3
4
5
6
7
8
9
10
11
12
13
14
  // returns all rows with requested query in database
  GetRows(height: number, amount: number): any {
    const sql = `SELECT senderId,
                 recipientId,
                 amount,
                 height
                 FROM transactions
                 WHERE event = ?
                 AND height > ?
                 AND amount > ?`;

    const rows = db().query(sql, ["balances.Transfer"], height, amount);
    return rows;
  }
Note: Staking rewards and other niche transfers of native assets are not tracked only balance transfers for now.
With the transaction data I am able to create CSV files for nodes and edges. In this case the nodes are non repeating user addresses that have been the sender or receiver of a balance transfer transaction. For this project I also use API calls to a polkadot node to get the current balance of the address for each node. Snippet of a Node.csv file example:
| id | Label | Balance |
|---|---|---|
| 16cfqPbPeCb3EBodv7Ma7CadZj4TWHegjiHJ8m3dVdGgKJk1 | 16cf…KJk1 | 0 |
| 1mndd9E8kssCxXDacCbKw3iwFQwdABiFrE8fVRKS5SeS4E4 | 1mnd…S4E4 | 0 |
| 1pqYSLsSSzLCkTdGqebAEwLRSUyPS2JQQzQu1Uvhn85siJm | 1pqY…siJm | 0 |
| 13YpnBTwkLbUjAg2raa286UkRFvvGJ3jdXSfiHeLf5AQ1kVK | 13Yp…1kVK | 1118622.73955348 |
| 1H1aMkpYrkjtcQHXc5Zqd2jXxMQqBh7ZnkkRSu62Yz2vEbK | 1H1a…vEbK | 1500674.07784768 |
| 1W6f6T5mxz2ATndjakXBRvDzX36B7eDurbHEcDKMhnRH2Zx | 1W6f…H2Zx | 1500642.48497351 |
| 124Xmmo5dn4CStgvkwnmvBX9sYTPaJRYRCCsZ4CDfA1J8F7d | 124X…8F7d | 1501230.64040718 |
| 15j4dg5GzsL1bw2U2AWgeyAk6QTxq43V7ZPbXdAmbVLjvDCK | 15j4…vDCK | 45117043.96 |
| 16BPfNA5pVPs9KDWML4cds1dHrUxtRLeozMWqXEwHjqTn6YU | 16BP…n6YU | 1923324.50734206 |
| … | … | … |
Edge.csv files consist of a Source (senderId), Target (recipientId), Type (directed), Weight (amount), Block (height). Snippet of a Edge.csv file example:
Note: Source and Target addresses shortened for example
| Source | Target | Type | Weight | Block | Finalized |
|---|---|---|---|---|---|
| 14rS…oU7U | 153V…LNf | directed | 1712161.3994 | 1522890 | 1522896 |
| 16Li…YGLn | 13V…xMg | directed | 3521733.3645 | 1533617 | 1533623 |
| 13Vh…6xMg | 12xt…XkLW | directed | 3521733.3479 | 1533634 | 1533640 |
| 148G…Fgit | 1JVr…hath | directed | 1091082.654 | 1541641 | 1541647 |
| 13wz…AgoL | 121H…YMq5 | directed | 3999990 | 1580090 | 1580096 |
| 15aG…awQJ | 12uZ…Jmt2 | directed | 1200000 | 1581053 | 1581059 |
| 13fW…WVJ | 12gP…XLyr | directed | 3653176.83990174 | 1592949 | 1592955 |
| 12xt…XkLW | 13fy…ZEP | directed | 1320888 | 1607021 | 1607027 |
Importing the Node and Edge data into gephi I can create the crazy cool graphs featured here on this post. The exact method as to how I create the graphs with gephi involves quite a bit of tweaking, trial and error. The specific things I play with are the modularity, appearance tab, Yifan Hu Proportional algorithm, and labels noverlap adjustments. Example of Gephi:
Challenges
The size of the graph is dependent on the number of transactions included. More transactions means more nodes and edges. The graph at the top of this post includes a screenshot of part of a 30,000 transactions graph. At this scale it takes a very long time to load any changes and heavily lags my system. The largest graph I have made was with 69,000 transactions, but it takes about 10 minutes to just open the svg file and view it. Seeing as how the polkadot network transactions number will most likely grow indefinitely, I am most likely going to need a beefier computer. Until then I added functionality while creating the nodes and edges to filter out small transactions or transactions before a certain block height depending on requirements. With the filter it enables one to look at specific transactions for example only transactions greater than 10 million dollars or transactions for this month, week, or day. Filtering also cuts down on the number of nodes and edges making it more manageable.
In making the project, the biggest challenge I faced was accessing blockchain data from the Polkadot RPC. As the concept was relatively new to me and tutorial examples were far and few between, I found myself using Doc pages to build up an understanding of how to connect to endpoints and use different methods and queries to obtain the data that I needed. This is where I came to the biggest bottleneck of the project. As it turns out using api calls to get all of the transactions from a blockchain takes a very long time. Luckily after a bunch of searching I found the polka-store project created by github user TheGoldenEye who built a solution. Making api calls to a node to build a database with SQLite using polka-store means I only have to do the slow calls once. After I can access the database at a much more reasonable speed and create the nodes and edges.
Conclusion
The current outcome of the project is a functioning software that allows me to track transactions and use Gephi to visualize the information. I have future plans to expand the functionality of the project as the substrate chains Polkadot and Kusama have gained a large amount of complexity with the addition of Parachains. To do so, I will most likely have to explore and/or create new databases with para-chain transaction data.
Full project code can be found on my github at visualizing-substrate
Want to check out the graph from the beginning in more detail? Click here and you will get a white screen scroll down and right to get to the middle where the nodes are.